
Global Retail Statistics Data Analysis & Market Share
Introduction
Do you want to start a new retail business? If so, you need to know the current position of the retail business statistics. Otherwise, you can’t go ahead in such a business sector. That’s why knowing the pros and cons of retail statistics is very important.
In this informative article, we will discuss the present global situation of the retail business, as well as data analysis and market share. Go through our detailed guide for further details and make success your retail business!
Global Retail Market Statistics
Retail market rules and growth are changing or updating daily. That’s why we should get updated information on this market from different sources. When starting your retail business, you must make a report, including market size and retail data. As a result, you can get a clear concept from such information.
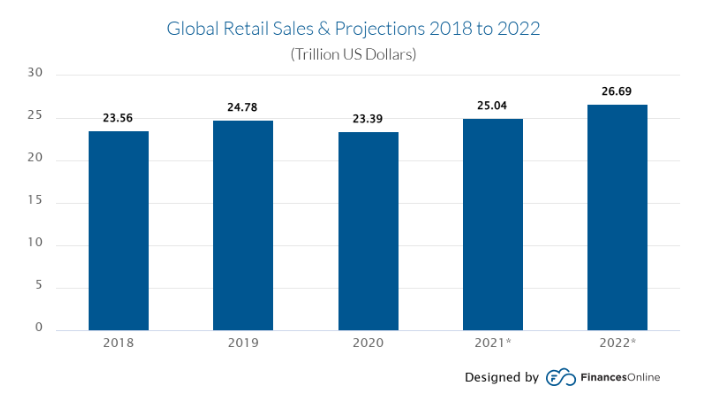
One of the retail data reports that global retail is doing very well, even in the COVID-19 pandemic. Thus, the retail market is always a thriving business sector.
- When you research the previous estimates, you will see that in 2019, global retail sales were to arrive at $25.28 trillion; in 2020, the amount reached $26.74 trillion. In mid-2020, the desired retail sales worldwide were $26.3 trillion. But at last, it reached $24.378 trillion.
- Considering the recent growth of the global retail market, it is clear that the recent retail market is better than before.
- In 2021, the international retail rebounded to 5.2% CAGR. Although there were a lot of challenges, global retail e-commerce sales grew by 27.5% that year.
- Likewise, China has an extensive e-commerce market. In 2021, their sales were
- $792.5 million, grabbing 33.4% of the global total.
US Retail Market Statistics
The US retail market is also growing day by day. Despite the fall of many big companies, US retail sales are rising rapidly. US retail marketers use modern tools to achieve success in their business sectors. Let’s see the US retail market statistics.
- There were 442,597 brick-and-mortar retail shops in the US in 2019.
- At present, there are 2.2 million e-commerce vendors in the US.
- In December 2020, the US retail sales were at $540.9 billion.
- In December 2020, The US retail need saw a 0.7% month-over-month decrease.
- The year-over-year growth was placed at 3.2%.
- The total sales growth was 0.6% in 2020. The growth rate is higher than in 2019.
- Also, retail sales grew more in 2020 than in 2019. It was from $343.150 million to $374.38 million, showing a 9.1% growth.
- But, unemployment in the retail sector stayed high at 6.7% in 2020 compared to 2019.
- In 2018, the average retail value was $53.98.
- The gross margin in retail was 50.96% in that year.
- Unfortunately, 5,994 US stores were closed in 2019 alone.
- Some big retailers are Payless, Gymboree, and Charlotte Russe.
Big and Small Retailers Statistics
- There are some top brands in 2019, such as Amazon, Apple, Google, Microsoft, and Visa.
- 52.8% of American customers visit Walmart.
- In 2020, the weekly number of Walmart visitors was about 265 million.
- In 2020, Walmart had 11,501 stores.
- In 2019 the average furniture revenue was $40,000, and beer, wine, and spirits ($39,000).
- Small vendors hire 39.8% of all retail workers.
- Such small vendors have an average monthly revenue of $22,341.
- The gross margin was an average of 51%.
- In all, retail executives are interested in the following sectors;
- Digital acceleration (88%)
- Supply chain resilience (78%)
- Health and safety (78%)
- and cost structure realignment (72%).)
However, big or small retail marketers are using new digital tools such as solutions for inventory management.
Leading Inventory Management Software
There are some inventory management software. Let’s have a look at these.
NetSuite ERP:
This excellent software provides complete visibility over your supply chain, from products to other economic data. Likewise, it lets you learn how it helps you optimize all the processes in our NetSuite ERP review here.
Vend:
It’s a POS software that works on PC, Macs, and iPads. You can know how it leverages and how you use the other features.
Zoho Inventory:
This go-to inventory program is excellent for big and small retailers. It will help you to track inventory and order quickly.
QuickBooks Enterprise:
This software is beneficial for the inventory management module. That’s why read the QuickBooks Enterprise review for more details.
TradeGecko:
It’s a popular inventory management software with a clean UI and robust web-based deployment. Thus, read more about the features and TradeGecko review.
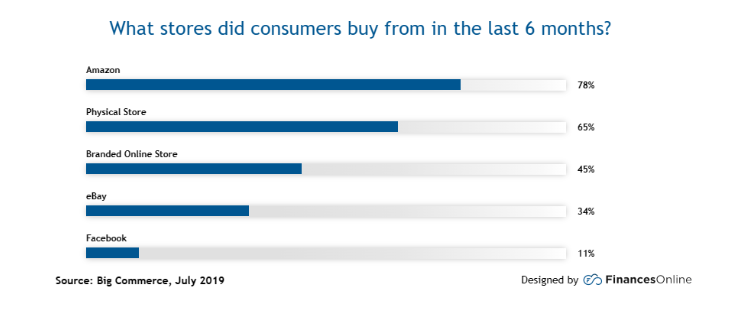
Customer Retail Preferences Statistics
Before the pandemic hit, there was less value in online stores. Besides, most of the customers preferred physical stores over online shops. The consumers liked events organized by the stores. This is how the pandemic changed consumer behaviors, and so many people feel anxious about physically shopping. Let’s see the customer retail preference statistics.
- In-store shoppers spend 69% of their total income each month.
- Yet, 40% of US consumers reduced retail spending after the Covid-19.
- 87% of customers said they want to sell in physical stores.
- 81% of customers also said they want to attend parties organized by physical stores.
- On the other hand, 80% of customers want to participate in a product tutorial by physical stores.
- 71% of customers said they wanted to attend a game or competition managed by physical stores.
- In 2018, 82% of buyers participated in a retail event.
- Thus, COVID-19 caused a significant change in consumer behavior.
- There is a considerable possibility of supporting retail brands, and about 89 % of US consumers support this, which has a positive impact on the world.
- 36% more customers tested a new product brand during the pandemic.
- After COVID-19, 79% of consumers prefer self-checkout.
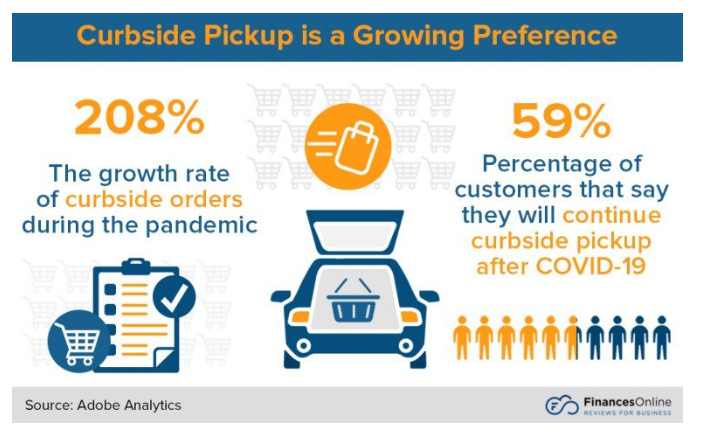
- Meanwhile, Curbside orders increased by 208% during the pandemic.
- 59% of customers want to continue curbside pickup after the COVID-19.
- Based on a pre-Thanksgiving survey completed in 2020, 56% of customers are anxious about shopping in physical stores.
E-commerce Statistics
The COVID-19 pandemic has undoubtedly driven more consumers to welcome e-commerce. Understanding the latest shopping statistics will make you aware of global economics.
- Based on the research of 2019, e-commerce only comprised about 9.46% of retail sales. Further, e-commerce took 14.3% of the pie in the third quarter of 2020.
- Only three executive organizations have mature digital capabilities. Such as contactless capabilities, significant investments in e-commerce, and other technology upgrades are underway.
- 40% year-on-year of unique online shoppers increased during the pandemic.
- Americans have around 70% online shoppers.
- Also, 25% of American adults buy their products from online.
- In 2020, more than half of US people have purchased groceries online.
- Half of US consumers like to shop for holidays through online search engines or only retailers.
- About 20% of online buyers return their online purchases in-store and make an additional purchase.
Social Media In E-commerce
Social media has made a significant contribution to the economy. Also, Facebook, Whatsapp, Twitter, Instagram, Linkedin, and YouTube are helping e-commerce to proliferate. Social media management software is a popular tool in the e-commerce sector.
- In this regard, Facebook is one of the most popular consumer shopping platforms. Around 85% of orders from social media channels come from Facebook.
- 84% of US online purchasers review at least one social media platform before buying.
- 39% of Americans share their experiences on social media platforms.
- 30% of online buyers have posted feedback online.
- $55 – the average order value for customers comes from Facebook.
- $46.29 – the average order value for consumers comes from Twitter.
- Based on a survey in 2029, 25% of e-commerce sellers planned to sell directly on social media in 2020.
- In 2019, 15% of e-commerce marketers sold their products on social media.
Mobile Retail Statistics
Mobile is another effective medium that has increased the possibility of e-commerce and retail business. Likewise, mobile devices have a great contribution to growing retail businesses all over the world through social media.
Once, mobile phones were a medium of communication with others, but now, they serve as an internet hub anywhere and anytime. Let’s see the mobile retail statistics.
- At present, 65% of all e-commerce traffic comes from mobile.
- 53% of e-commerce sales come from mobile devices.
- Fashion retailers transform 89.3% of mobile traffic into sales.
- In the last six months, 79% of smartphone users have completed their online purchases through a mobile device.
- At least once every six months, around 37% of mobile users make an in-store mobile payment.
- It is estimated that the global mobile payments market will be 55% by 2024.
Key Insights Of Retail Statistics
- Rise of E-commerce: The COVID-19 pandemic has changed the growth of e-commerce. In 2020, global retail e-commerce sales increased by 27.6%. It is expected that in the future 95% of all purchases projected to be made online.
- A shift in Consumer Behavior: The pandemic has also significantly changed consumer behavior. That’s why people are interested in online shopping instead of in store. Also, it increases the preference for curbside pickup and self-checkout. In 2023, Click-and-collect sales grew by 70.4% in the US.
- Mobile Commerce Dominance: Mobile appliances are crucial for e-commerce and retail future. At present, mobile devices contribute 65% of all e-commerce traffic and 53% of sales. Moreover, mobile payments are expected to grow wildly, handling an estimated $14 trillion in transactions in the future.
- Impact on Physical Retail: Due to COVID-19, almost all physical stores remained closed. Also, many brick-and-mortar stores were closed at that time. It was a record in retail industry statistics that 12,200 US stores closed in 2020.
- Specialized Integration: successful retailers always try to improve the customer’s experiences. That’s why they use specialized integration like CRM tools, inventory management systems, and mobile payment solutions.
FAQs
- How has the pandemic affected retail sales globally?
- In 2020, the pandemic led to a reduction in global retail sales by 3%, totaling $23.389 trillion. After a few years, e-commerce sales grew remarkably by 27.6%. As a result, consumers became interested in purchasing from online platform and changed their behavior purchasing towards online platforms.
- What is the current state of the retail market?
- Based on April 2023, the global retail market was esteemed at $29.3 billion. In 2022, these rates increased from $27.2 billion at a CAGR of 8.3%, and the report is based on the AI research company ReportLinker’s 2023 report. Based on this report the worldwide retail market is expected to reach $38.7 billion by 2027.
- How important is mobile commerce in the current retail landscape?
- Mobile commerce is essential for the current retail landscape. Based on various research, 65% of all e-commerce traffic and 53% of e-commerce sales come from mobile commerce. Moreover, mobile payment apps make the payment system very easy for online consumers.
- What is the growth rate of the retail industry?
- There is a monthly update of US Retail Sales Growth YoY data. According to such data, the average growth rate from Jan 1993 to May 2023 is 4.7 %.
- Which countries are leading in e-commerce sales?
- China is the leading country in e-commerce sales and in 2023 the sales were $3.02 trillion. Besides this, the USA grabs the second position in e-commerce sales and in 2023 e-commerce Sales were $1.16 trillion. The UK is also one of the leading in the e-commerce industry and in 2023 e-commerce Sales were $195.97 billion. Japan, South Korea, India, Germany, and Indonesia as other countries are leading in e-commerce.
- What are the global retail sales statistics?
- Global retail sales started in 2021 and stood at an impressive $26.37 trillion. This robust figure reflects the retail sector. Also, it is overcoming various challenges and fulfilling consumer demands on a huge scale.
- What are the statistics of the retail industry?
- Around 55 million people get jobs in the retail industry in the U.S. hence, we can say it’s the largest private sector for employment in the country. Now, there are two new retailers opening for every retail store that is closed.
- How are small retailers adapting to the changes in the retail market?
- Small retailers are using digital tools like inventory management systems, online business platforms, and mobile payment solutions. That’s how they are improving the customer experience. As their business size is small, they can easily adapt to any changes in the retail market.
- Which country has the largest retail market?
- Walmart, Amazon, and Costco are the top 3 retail companies in the world and the countries are situated in the USA. In 2023, the USA reached over seven trillion U.S. dollars in the total retail market.
- Who are the top 3 online retailers?
- Due to the pandemic, many consumers tried new shopping technologies and online channels. Likewise, Amazon, Walmart, and eBay are the biggest retailers by ecommerce sales.
- Which country is best for big data analytics?
- The United States of America is one of the best countries in which to study data science. Also, there are some other top-ranked universities in the world, including the United Kingdom, Australia, Canada, Singapore, Switzerland and Italy.
Last Words
Due to the COVID-19 pandemic, online stores, e-commerce sectors, and retail businesses faced significant losses. As the pandemic forced people to stay home as much as possible, they had to shop on e-commerce platforms instead of retailers. This way, the e-commerce platform rose gradually and became popular with the consumer. That’s why looking hard at retail statistics is essential in this competitive business world to succeed in this sector.
As mentioned earlier, our article will help you know all the nitty-gritty of global retail statistics!
Related Posts

Full Grain Leather Weather Wallet : A Timeless Best Investment

Mauritius Leather Jackets : Timeless Fashion, Unmatched Quality